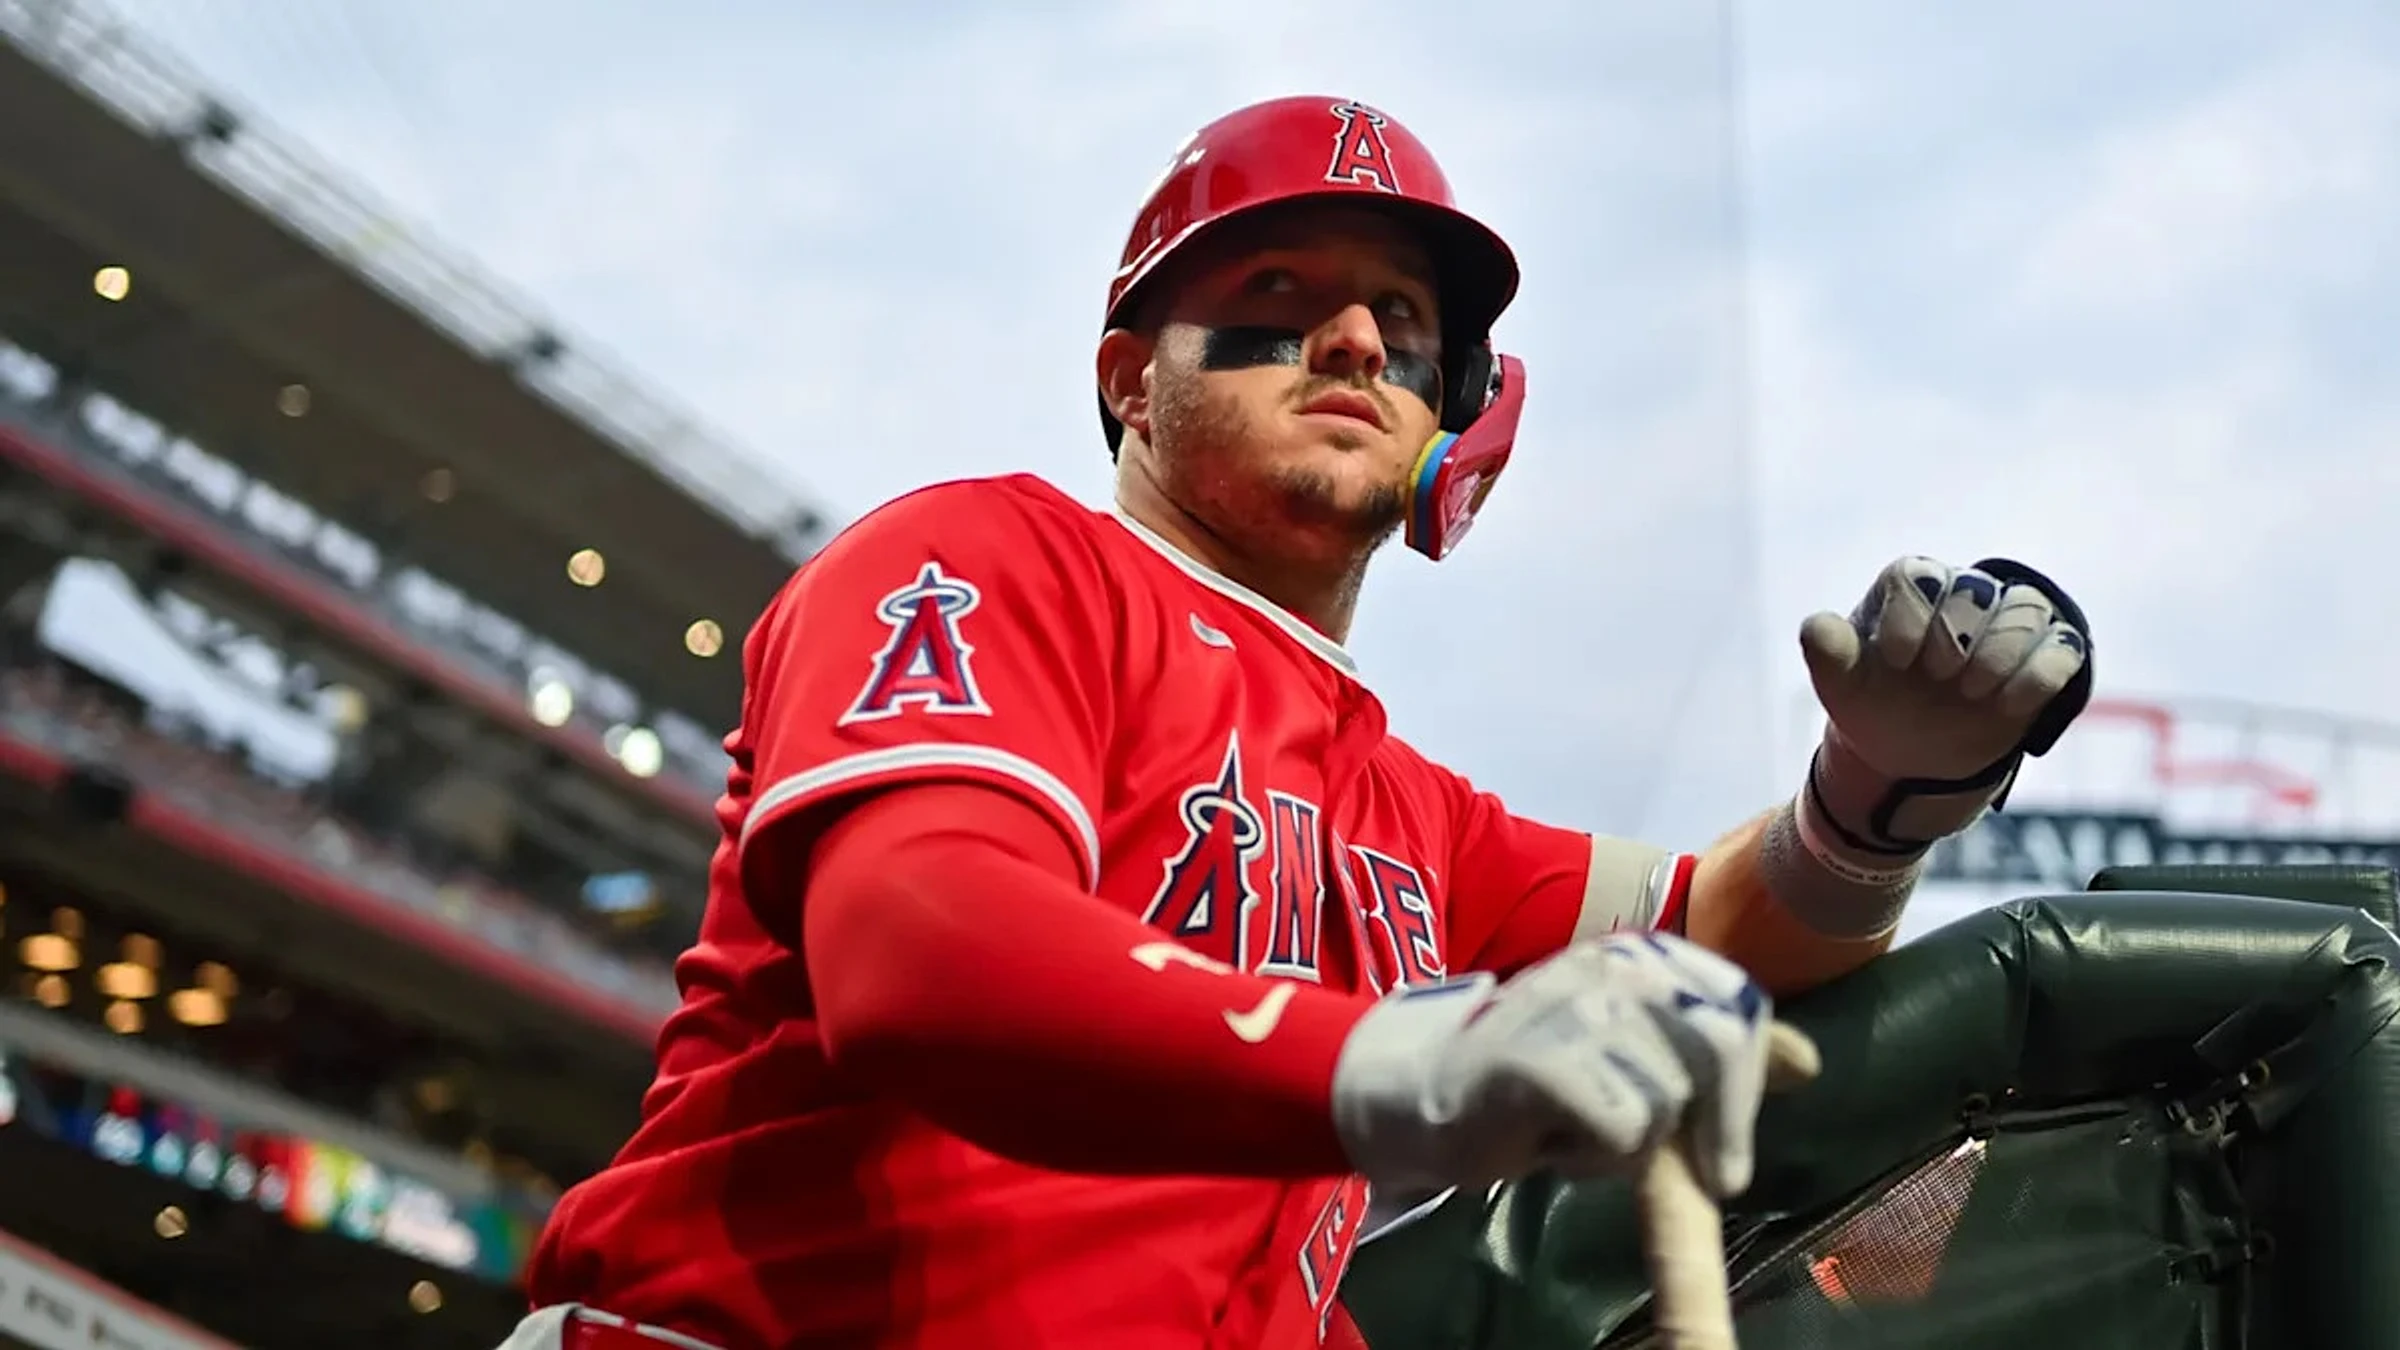


The Angels and Royals meet Sunday night at 7:20 p.m. ET on Peacock and NBCSN. That’s the listing. The reason to watch is Mike Trout.
Trout was the best player in baseball for a decade, the guy who bridged the gap in greatness between Barry Bonds and the current era with Aaron Judge and Shohei Ohtani.
Only a small handful of players reached the mountaintop of Trout’s peak. His MVP finishes from 2012–19 tell the story: 2nd, 2nd, 1st, 2nd, 1st, 4th, 2nd, 1st.
And it’s important for me to note that Trout finished second behind Miguel Cabrera in both 2012 and 2013 despite higher WAR totals.
Trout finished second in 2015 to Josh Donaldson despite having a higher WAR, higher batting average, on-base average, slugging percentage, OPS, and the same number of home runs (41). Donaldson had 123 RBIs and his team finished in first place.
My point is that three-time MVP Mike Trout probably should have five or six MVP trophies.
Why is it so easy to forget about the greatness of Trout?
There are a multitude of reasons. He has played in Anaheim his entire career, where the team takes a backseat to the Dodgers, the Lakers, the Rams, UCLA, USC, and a sprawling amusement park.
He doesn’t have a catchy/memorable nickname. Even his initials (M.T.) sound like the word empty (vacant, blank, void).
Mike’s stats just don’t look as impressive as those compiled by the greatest of the generation before or the generation that has come after him. But Trout’s numbers stick out like a sore thumb amongst his contemporaries.
1. 1.002 Mike Trout2. .930 Joey Votto3. .916 Bryce Harper
OPS is a very useful tool to evaluate players. It is simple to calculate (on-base percentage added to slugging percentage) and—according to one scout, gives you about 90% of what you need to evaluate players.
The trouble with OPS is that different eras have different run scoring environments. Look at the MLB average for OPS.
In 2000, teams scored 5.14 runs/game, and the average OPS was .782.
In 2014, teams scored 4.17 runs/game, and the average OPS was .700.
In 2023, teams scored 4.62 runs/game, and the average OPS was .734.
From 1997-2007 (when there were 9.63 runs/game), there were 14 players that had an OPS over .930.
From 2011-2021 (when there were only 8.82 runs/game), only one player (Trout) had an OPS over .930 Trout’s numbers look good in any generation. But just a few years earlier similar or superior numbers were put up by Barry Bonds, Todd Helton, Manny Ramirez, and company. And when Mike began losing time to injuries, numbers from Shohei Ohtani and Aaron Judge seem to have wiped Trout’s greatness away. Let me put Trout’s numbers into a bigger blender.
wRC+ is an advanced stat that will put all offense into proper context. The beauty of weighted runs created plus is that it is a statistic that weighs each offensive action properly but also adjusts performance based on park effects and league average.
It tells you how much better or worse a player was than league average, which is 100 during each season.